N****지표
짧은주소
본문
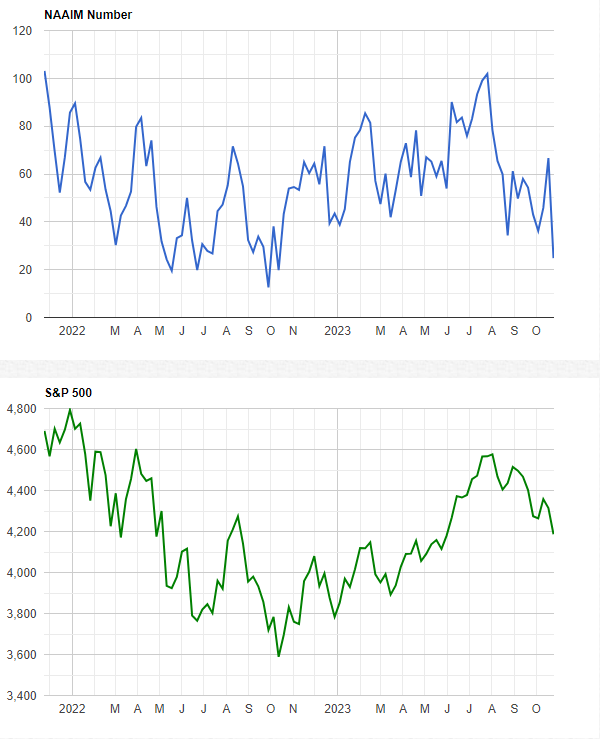
The N**** Exposure Index represents the average exposure to US Equity markets reported by our members.
The green line shows the close of the S&P 500 Total Return Index on the survey date. The blue line depicts a two-week moving average of the NAAIM managers’ responses.
It is important to recognize that the NAAIM Exposure Index is not predictive in nature and is of little value in attempting to determine what the stock market will do in the future. The primary goal of most active managers is to manage the risk/reward relationship of the stock market and to stay in tune with what the market is doing at any given time. As the name indicates, the NAAIM Exposure Index provides insight into the actual adjustments active risk managers have made to client accounts over the past two weeks.
N**** 노출 지수는 회원들이 보고한 미국 주식 시장의 평균 노출을 나타냅니다. 녹색 선은 조사일의 S&P 500 총수익률 지수 종가를 나타냅니다. 파란색 선은 NAAIM 관리자 응답의 2주 이동 평균을 나타냅니다.
NAAIM 노출 지수는 본질적으로 예측이 아니며 주식 시장이 미래에 어떻게 될지 결정하는 데 거의 가치가 없다는 점을 인식하는 것이 중요합니다. 대부분의 액티브 매니저의 주요 목표는 주식 시장의 위험/보상 관계를 관리하고 주어진 시간에 시장이 하는 일을 계속해서 파악하는 것입니다. 이름에서 알 수 있듯이 NAAIM 노출 지수는 활성 위험 관리자가 지난 2주 동안 고객 계좌에 적용한 실제 조정에 대한 통찰력을 제공합니다.
해당 지표가 100이면 Short을 쳐도 된다????


댓글목록
등록된 댓글이 없습니다.